The AMG Kernel originates interactive dashboard visualizations of changing values and sentiment with trusted market data:
The capital asset templates visualize demand changes in institutional security share levels and mutual fund (incl. ETF) investment cash flows; regulated data paradigm vectors of continuous values to template the nature of changing investor sentiment.
The interface of market data and analytics is tooled for investment managers, investors, exchange trading participants, and non-Financial interests. The interactive dashboard mechanism templates changing values to non-Financial dimensions of changing sentiment (Census, Social, Tech, Rideshare, Determinative....) that are relevant, meangingful, and matter.
Subscriptions to visualization overlays of SEC filings enable unique views of changing values of securities; interactive analytics features available in AWS QuickSight, SalesforceTableau or other commoditized cloud and visualization products that augment learning software like AWS SageMaker.
Researchers visualize and interact with the continuous market data using customizable templates developed to train AI with any visualization platform.
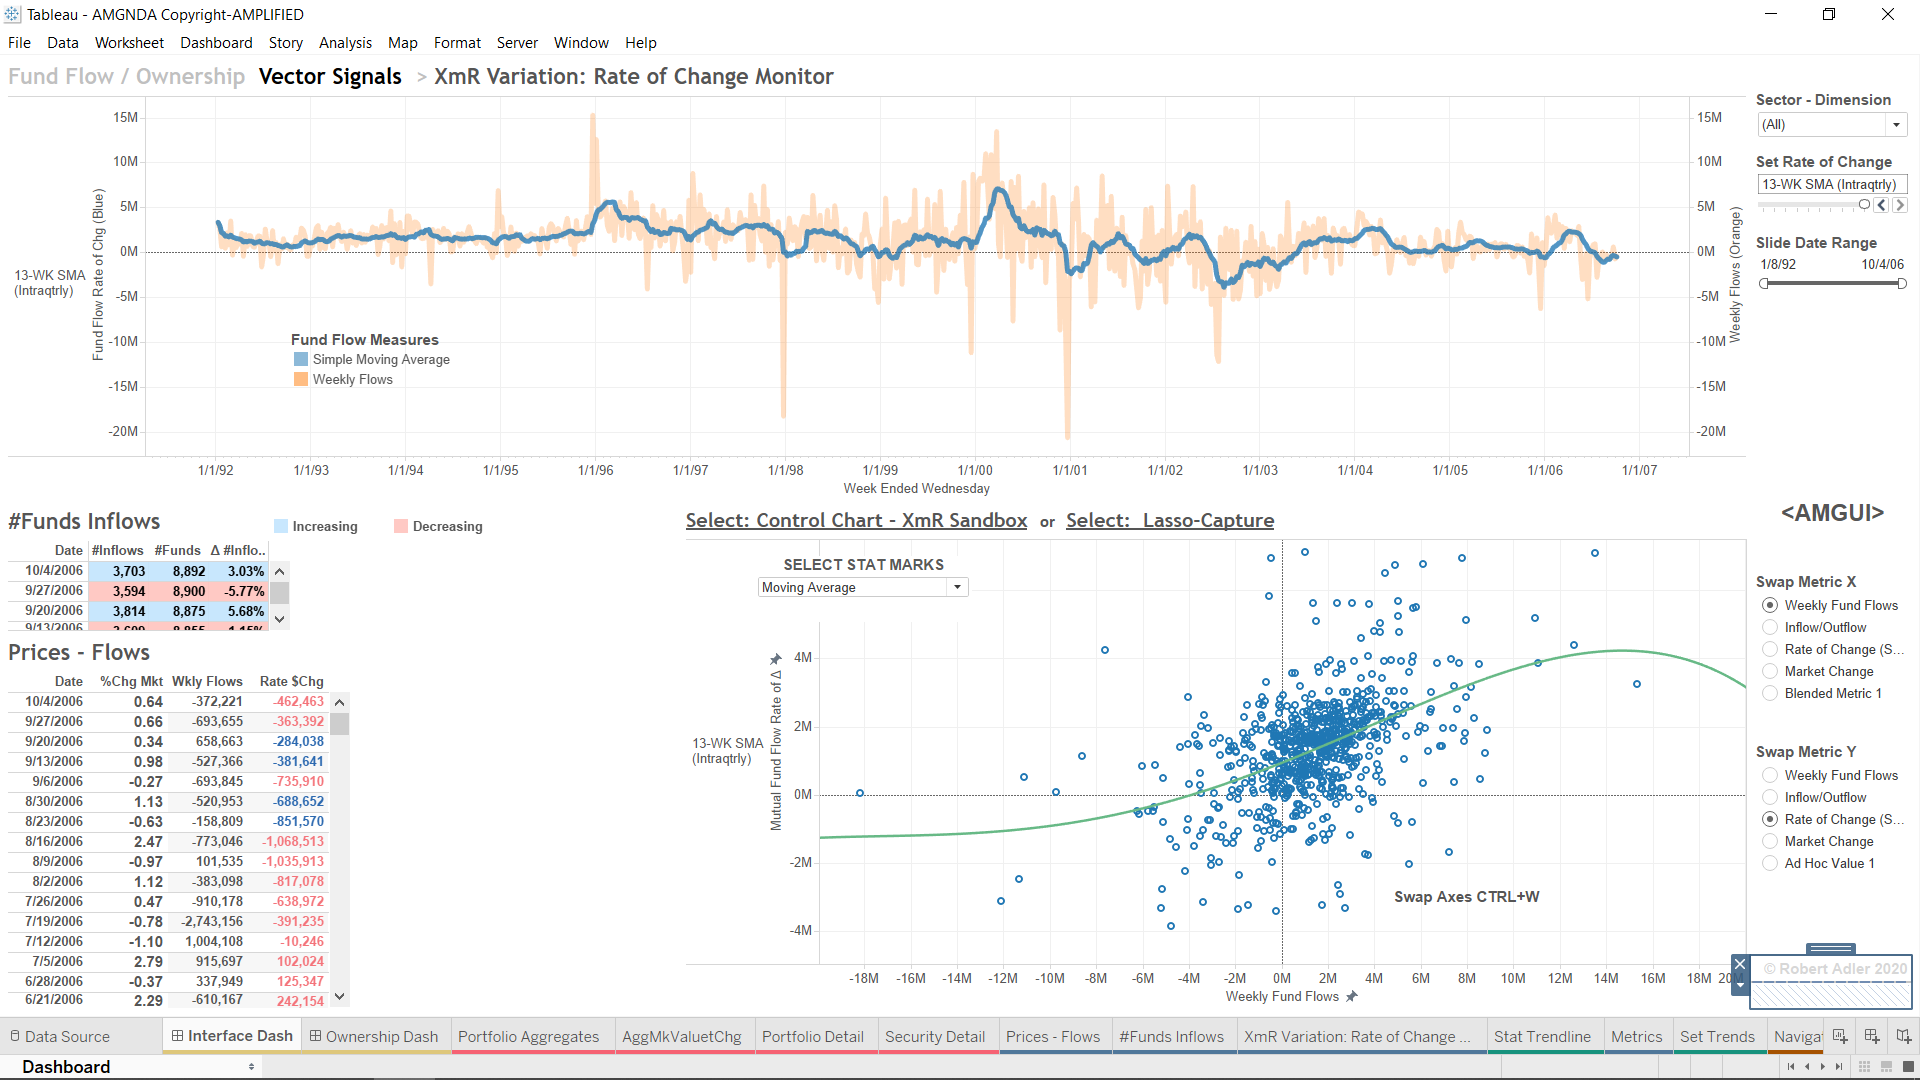
The interface facilitates exploration of variances, patterns, and relationships in market vectors of changing sentiment.
Financial market research is produced for interactive analysis and visualization of asset level changes over periodic intervals (time-series analytics).
The market data templates integrate within AWS QuickSight, Salesforce Tableau, and ad hoc information dashboard solutions with non-Financial structures for visualizing the Financial data metaphor of levels and flows of focus and detail.
The interface maps and templates market data to column joins within the AWS and Tableau platforms to extract and uniquely learn how continuous regulated information is changing in Financial and non-Financial data structures.
AWS QuickSight and visualization software like Tableau facilitate familiar interactive dashboard analytics of user defined metadata and SEC asset data filings that are filtered to mine, manage, and visualize uniquely cogent perspectives of continuous market data reported in two vectors of sentiment that describe how asset values are changing.
The interactive dashboard enables users to monitor and visualize random and non-random variation. Control limits (dashboard 'etch') are created and algorithms continuously train AI for reset or alerts; signaling knowledge, insights, and pre-qualified actionable opportunities.
In addition to 13F and other portfolio filings, weekly mutual fund flow sector aggregates can be interactively sourced, blended, and visualized using a connection to mutual fund (including ETF) net investment flow metadata. The familiar crosstab of fund flow updates becomes visualized in AWS QuickSight and Tableau CRM for interactive analyses. The example data view is transformed from numeric original 1992 flat-file research, to continuously descriptive 2025 multidimentional visualizations of mutual fund (including ETF) investor activity.Quantitative measures of shared questions about common values template qualitative notions of sentiment, that project the fund flow asset changes as proxies for market demand, with filters of the nature of investor activity in $40 Trillion fund asset levels regulated in >20,000 share classes and fund portfolios (including ETFs), managed by thousands of regulated professionals for millions of investors.
Visual queries extend seamlessly beyond the interface; with no programming necessary in AWS QuickSight or Tableau CRM. Uniquely reusable templates are easily developed and expanded to extend multidimensional sentiment analyses beyond the interface with each structured data set; and uniquely beyond the economic dimension at scale to Media, Tech, Social, Rideshare, and other Determinative, non-Financial analytics of how things are changing.
Level of detail ETF flow analyses are granulated to name dimensional sets like mutual funds and classes like 'xETF', a different class of mutual fund flow metadata than 'ETF only'. Similar granulation is achieved differentiating US regulated assets from non-US regulated assets in a (less regulated) global data set. Multidimensional data set subclasses, active or passive, offer original perspectives of investor sentiment that are helpful in gaining insight to the complexities of market action using structured non-fundamental data.
Interactive charting parameters name, filter, and draw user-assigned control points in the data view.
Multidimensional data sets and conditional rule-sets trigger cloud functions and log actions on continuous data residing in AWS S3 buckets and managed with cloud services, eg;Fiduciaries uniquely integrate scheduled events that identify and access the Truthful EDGAR data from www.sec.gov; a logical model derived from SEC reporting requirements - to identify and access structured data; then originate the query logic for dashboard visualizations of any measure of value.
© 2025 Robert Adler TXu 2-489-251 Amplified, All Rights Reserved